
Facebook is one of the biggest platforms for businesses to meet their potential customers. Whether you have been creating Facebook ads for a while now or you are just starting out – understanding what works for your business is very crucial to have a successful ad campaign.
One of the biggest mistakes marketers make when it comes to analyzing their Facebook ad metrics, is they feel like they have to track everything. As a growing business, tracking every Facebook metrics, with hundreds of data points can be intimidating and exhausting. You only need to know those Facebook metrics that can give you an insight into how your ad campaign is performing.
Here’s a list of 6 Facebook metrics you need to track for your business:
1. Click-Through-Rate
One of the first Facebook metrics to check is the click-through rate because it lets you know if your ad is compelling people to click on it. It helps you understand if your ad copy and creativity are appealing to your target audience.
Facebook looks at CTR in two different ways. First and the more obvious is the number of people who clicked on the link after viewing your ad (Link-click-through). The second kind (All) is the number of people who have interacted and engaged with your ad by liking and commenting on it, sharing it, swiping through the carousel ad, etc.
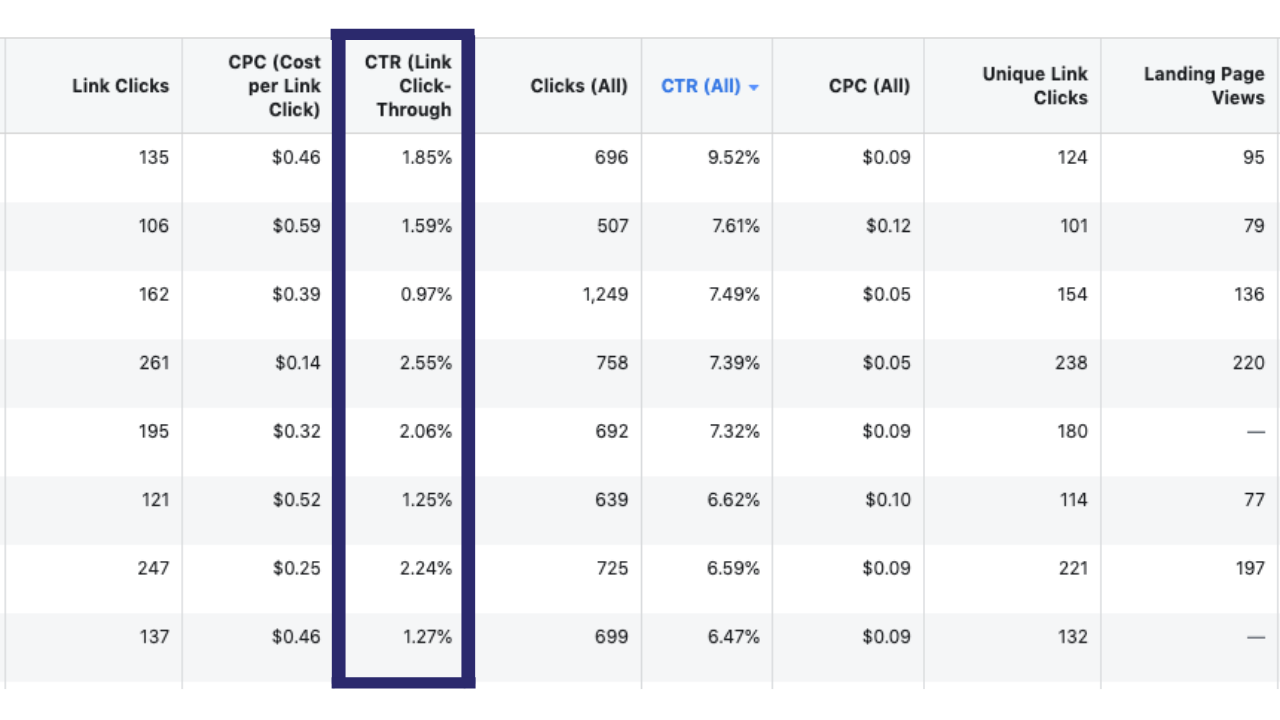
If you’re running feed ads on Facebook, your CTR should be 1.5% or more. If it is not, you should consider changing the creative and ad copy. A common practice between marketers is to A/B test ads to check what gives them the best results.
2. Cost Per Purchase
As the name suggests, the cost per purchase is to understand how much you’re spending to sell an individual product and whether it is at a profit or a loss. It tells you the ad spend amount to sell one product.

If you have the Facebook Pixel, it will automatically calculate this for you. Using this figure you can calculate your profit or loss margin and alternatively also your ROAS.

So my ad spends on a single product costing $20 was $2.5, giving me a $17.5 profit.
Note: please remember to minus your business’s investment to know your final profit margin.
3. Purchase Conversion Value

This Facebook metric tells you the total value of purchases made because of your ad campaign. This is the total revenue generated from your ad spends.
You can also manually track this metric by calculating the money that is coming into your business account, however, Facebook makes it simple if you have the Pixel installed.
If your Purchase conversion value positive (above $0), it means that your ad efforts are working and you’re making sales. However, the PCV is $0, there is something wrong with your Facebook ads and you should try something else.
This Facebook metric is then used to calculate your return on ad spend (RAOS).
4. Return on Ad Spend (ROAS)
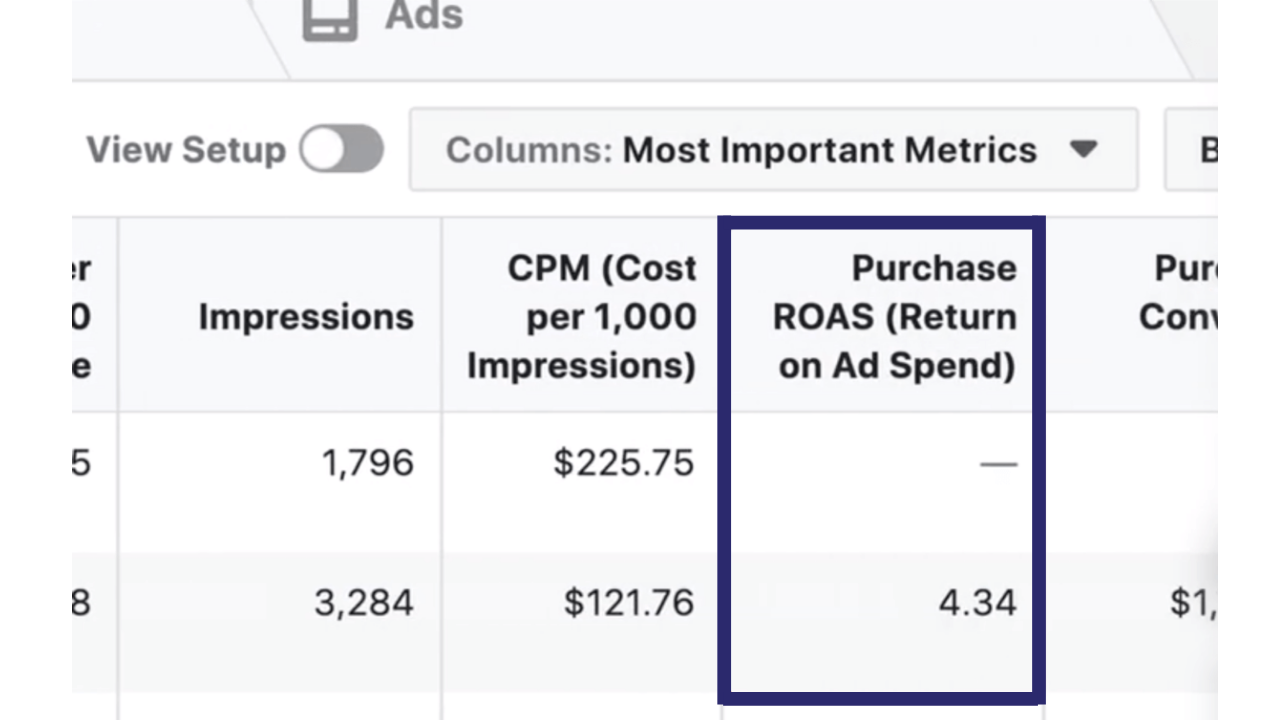
One of the most important Facebook metrics, the return on ad spend is the amount of revenue you generated for every dollar you spent on advertising.
This Facebook insight lets you analyze how successful your ad campaign is performing, in real numbers. To calculate the ROAS, you have to simply take the total revenue generated (purchase value column in Ads Manager) and divide it by the total ad spends of your campaign.
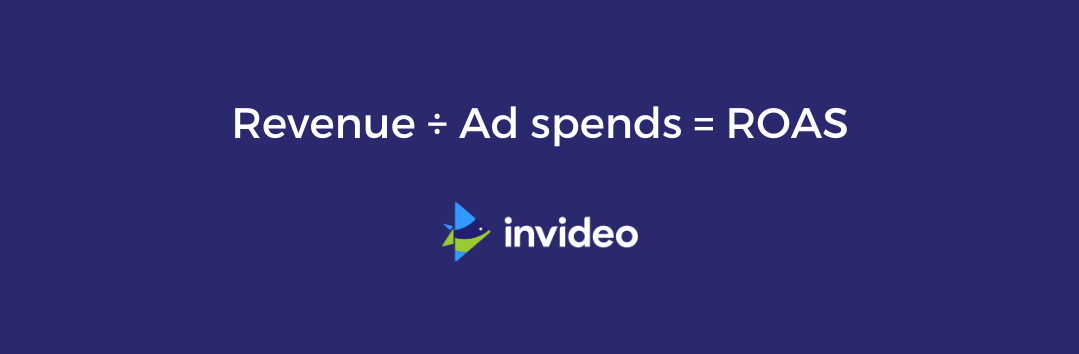
For example, if you sold 5 products, each costing $20 from your Facebook ad campaign in a week, your revenue is $100. To make those sales, you spent $25 on Facebook advertising.
So, your ROAS is:
100 ÷ 25 = 4x
The x represents the multiple of 1. This means every time you spend a dollar on Facebook ads, you get $4 in revenue.
That means, when your ROAS is positive or greater than 1, you’re generating more revenue than the money you spent on the advertisement. Reverse it back – if your ROAS is negative or lesser than 1, you’re spending more on advertising than the amount you generate in revenue.
Any business needs to know that your RAOS is not equal to your ROI because it does not factor in the other expenses such as employee salaries, bills, rent, software, and tools, etc.
If you want to calculate your ROI, use this formula:

In this case then, 100 ÷ (20+30) = ROI
100 ÷ 50 = 2x
So for every dollar, you spent overall, you earned $2.
5. Leads
When a website visitor shows interest in your product or service and interacts with your brand, they are called leads. This also includes people who opt-in to receive your emails and marketing messages.
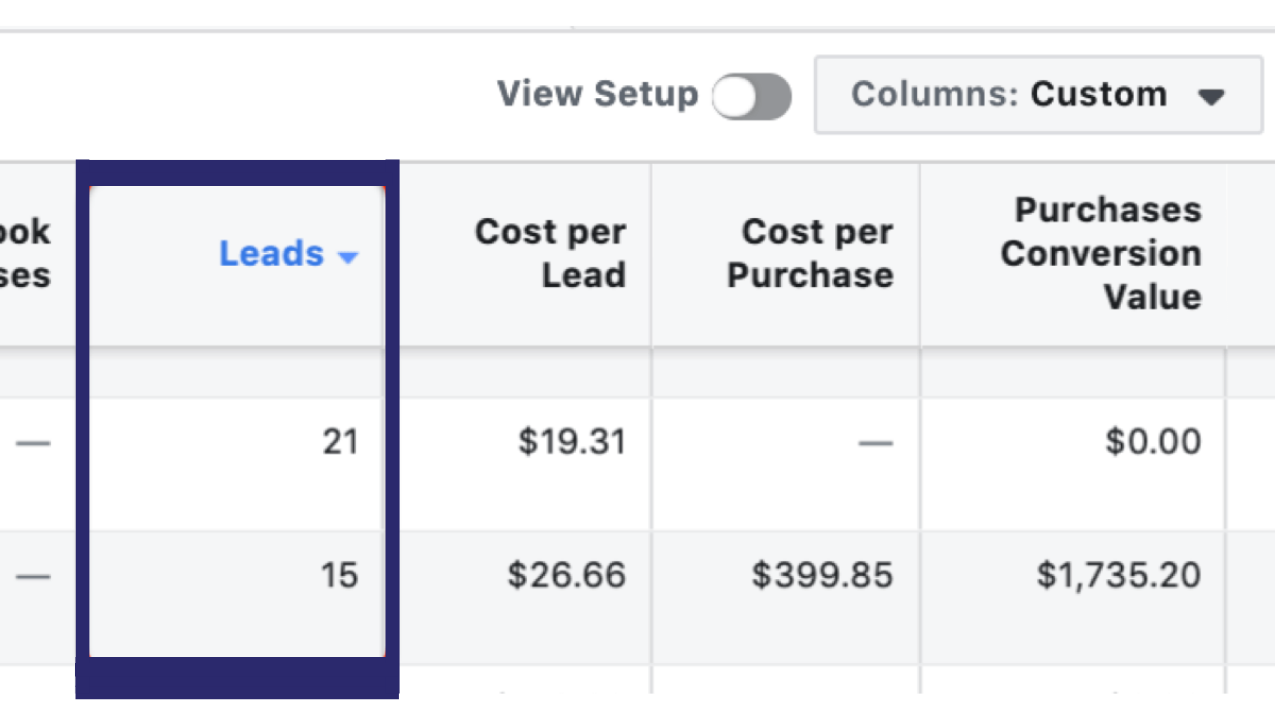
Every lead is an opportunity to make a sale. If you have Facebook Pixel installed, you will be able to retarget these leads based on their activity on your website.
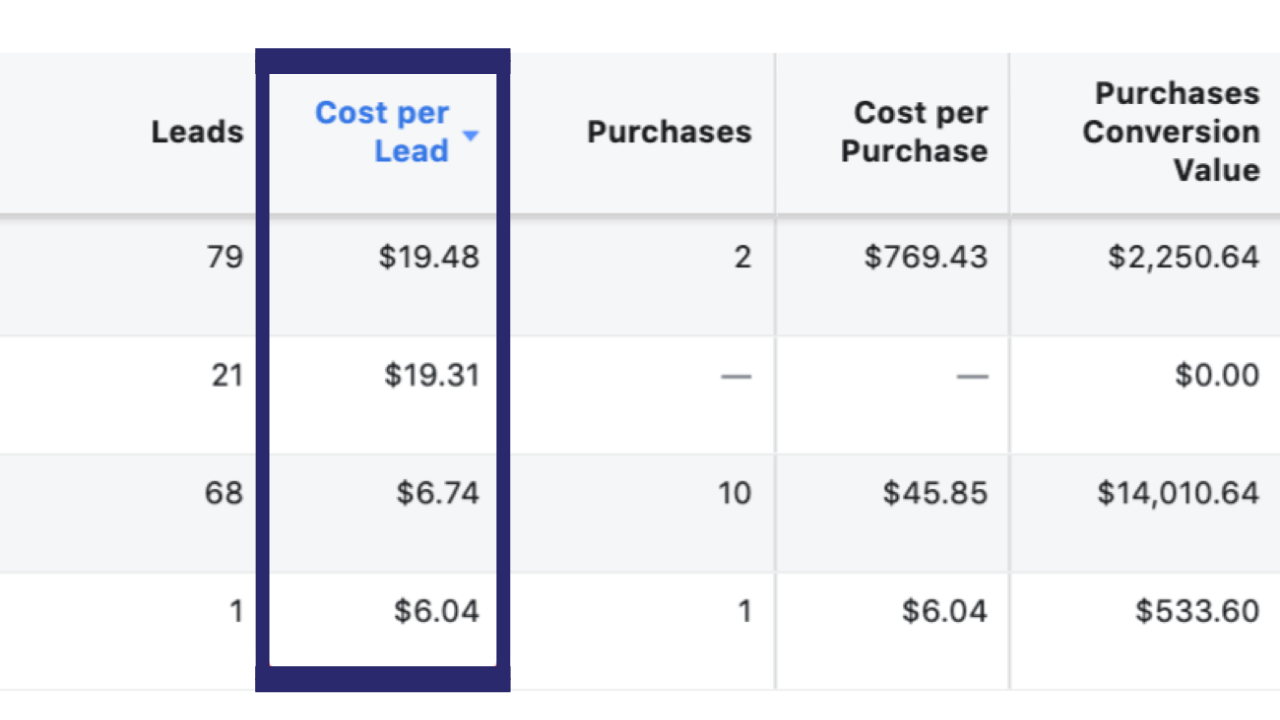
6. Cost Per Lead
The cost per lead is the amount you spend on acquiring a new lead. To calculate this, you need to divide your Facebook ad spend by the total number of leads that ad spend generated.
For example, if you spent $150 to generate 100 leads, your cost per lead is $1.50.
If you have Facebook Pixel installed and you use lead conversion as an event, you will get this data on your Ads Manager automatically.
All of these above Facebook metrics give you facebook insights by monitoring ad campaign performance. These are not qualitative metrics but actually point to your spending and the results you are getting from it.
If you want to know more about advertising on Facebook and what all goes into creating a successful ad campaign, you should read our A-Z guide on Facebook ads.