
How does YouTube count views? What is average watch time and why should I be interested in it? How to get more views on YouTube by leveraging data from my analytics? If you’re still trying to understand YouTube’s metric, we’ve made it simple by listing out everything you need to know.
Here is a complete breakdown of YouTube’s metrics and how you can analyze this data to create better content that adds value to your audience:
1. Watch-Time
Simply defined as the total amount of minutes a viewer has spent watching your video, watch-time is YouTube’s key metric. The more time people spend watching your video, YouTube presumes that it has value and recommends it to other users on the platform based on their previous search.
You can see your watch-time report on YouTube analytics. Using the watch-time report you can group your best-ranked videos and create a curated playlist for your channel and it also helps you to understand what kind of content gets the best response from your community.
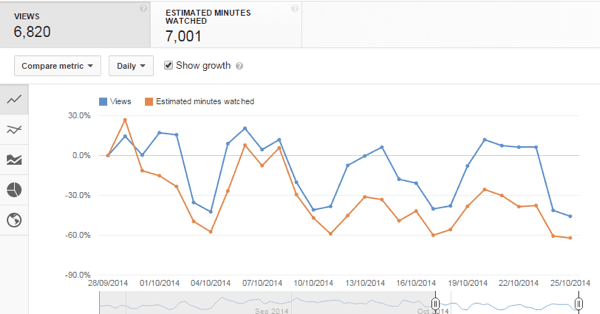
The watch-time report also gives you information on two other crucial metrics – the average view duration and the average percentage viewed.
The average view duration is the percentage of the video that the average viewer watched. This lets you measure your video’s ability to hold a viewer’s attention and can give you actionable insights on what works and doesn’t with your audience.
The average view duration lets you measure your video’s ability to engage viewers. It is the total watch time of your video divided by the number of video plays and replays. If your video can engage viewers and keep them watching, YouTube will start paying attention to your video and you may end up on its recommendations.
2. Audience Retention
Another key metric for YouTube is audience retention. It shows you the percentage of viewers who watched and left your video at every single moment in the video. Understanding this metric takes you one step closer to knowing your audience and what works and doesn’t work for them. Points that show high retention thus engagement can be made into self-standing videos, giving more valuable content to your audience whereas points of steep dips of engagement can indicate what was uninteresting in your video. Isolating these parts and making notes of what can be improved to better your viewer’s retention will pay off in the long run.
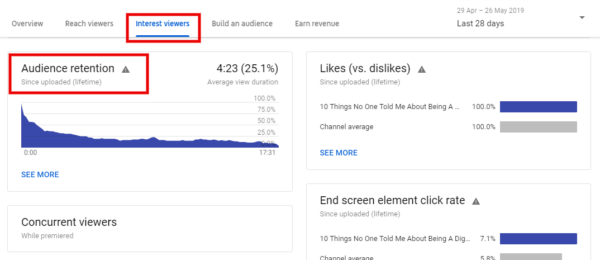
You can also check re-watches in the audience retention graph to check what parts of your video have been rewatched several times by your audience.
For example, as shown in the figure below, YouTube’s audience retention will show two graphs – the absolute retention curve and the relative retention curve. The absolute retention curve shows you how well your videos retained your viewers, while the relative retention shows you how well one of your videos retained its viewers compared to all other YouTube videos of similar length.

3. Demographics
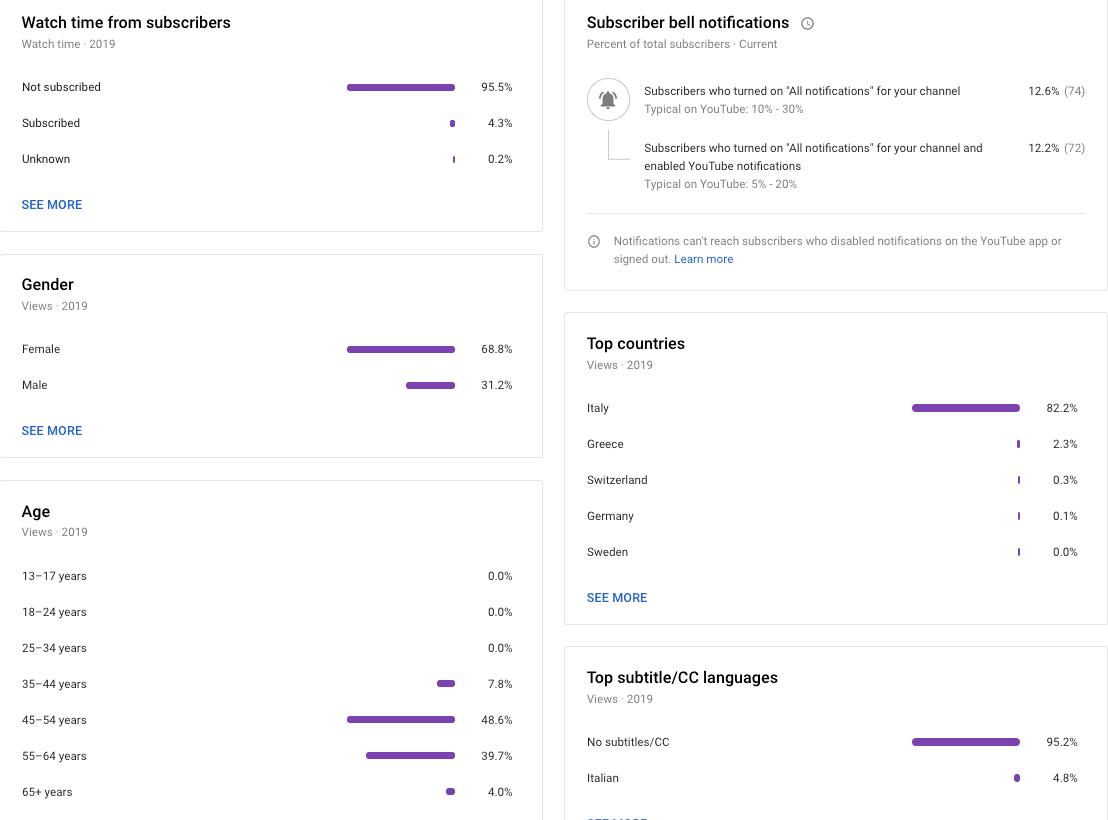
Understanding your audience is of utmost crucial if you want to be able to create value-adding content for them. The demographics analytics lets you analyze the age, gender, and geographical location of your viewers.
This allows you to create more focused content for your audience. You can also create target audiences and content buckets to segregate your audience based on their consumption.
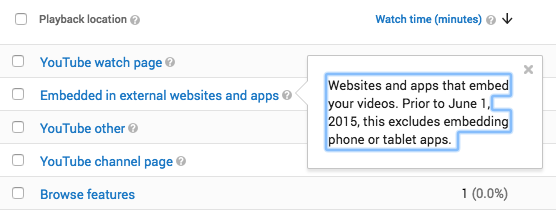
4. Playback Locations
It is important for you to know where and how your content is being consumed. Playback Locations lets you analyze where and on what channel your content is being viewed. Are being redirected to YouTube or are viewing the video on a different platform (like on your website). The views you get are divided between 4 buckets – YouTube channel page, YouTube watch page, embedded videos, and mobile devices.
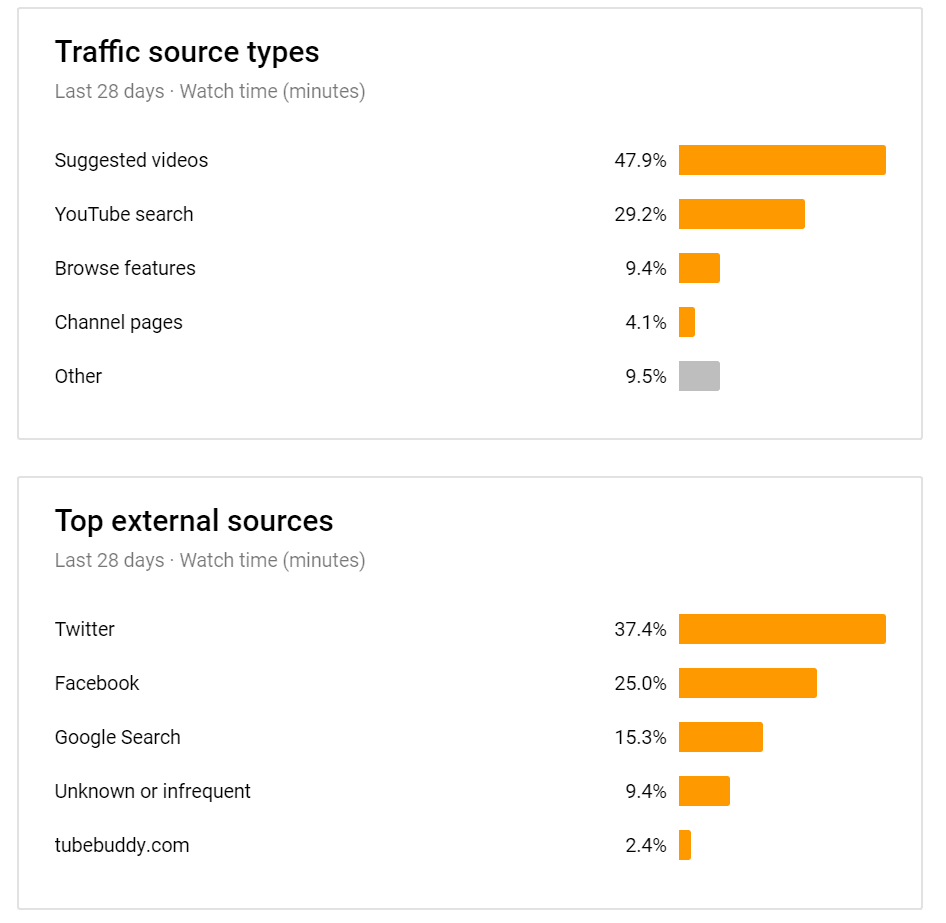
5. Traffic Sources
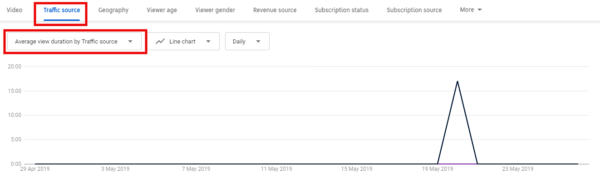
How is your audience discovering your content? Is it through YouTube search, a video card, YouTube advertising, or something else? This metric allows you to understand what is and is not working for your YouTube channel – in terms of drawing in traffic to your video.
6. Devices
This metric tells you what device your audience is viewing your video on – whether it is a phone, desktop, smartTV, or gaming console.
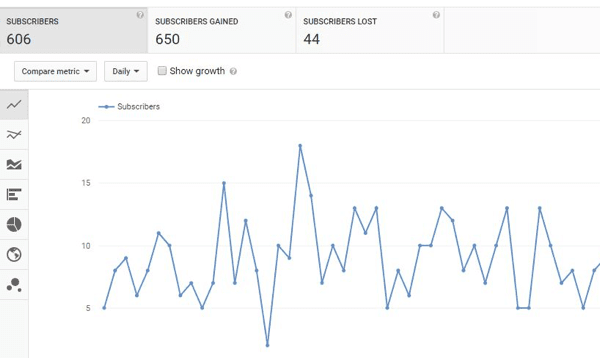
7. Subscribers
Tracking the growth in the number of subscribers every month can help you understand what content has worked and what hasn’t. You can also see where your subscribers are coming from – social media, YouTube ads, YouTube recommendations, etc.
You can also check the data on each video to know which one helped you gain the most subscribers.
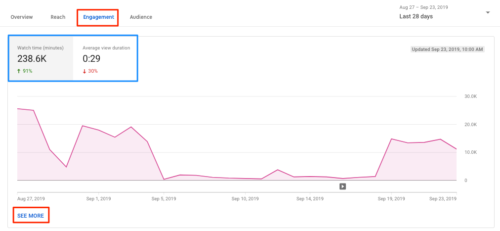
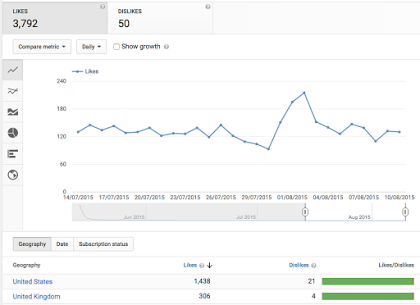
8. Engagement
Engagement is measured through the likes, comments, shares, and dislikes on a video and provides essential data to a lot of marketers. While likes and dislikes tell you what kind of content works and doesn’t, comments and shares can provide a deeper understanding of your community.
When a person comments on the video, he is looking to interact with you, which means the video struck a chord with him. When someone shares your video, it confirms their support and loyalty to your business or brand. A higher number of shares also indicates a higher number of backlinks, which improves the chances of your video getting ranked on YouTube.
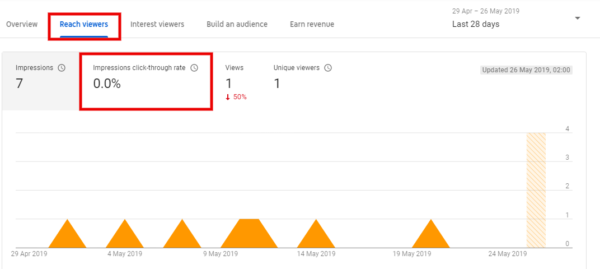
9. Impressions Click-Through Rate
The impressions click-through rate measures your video’s ability to get people to click on it when they see it on their homepage or recommendation section. A high click-through rate means that your title and thumbnail were captivating and the topic was of interest to a sizable audience on the platform.
Using this metric, you can improve how you communicate with your viewers through the title and thumbnail.
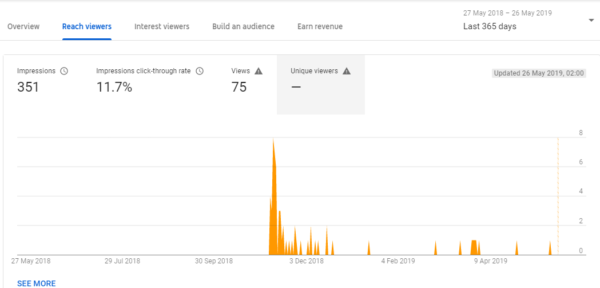
10. Unique Viewers
Unique viewers are the estimated number of individuals who watch your videos over a certain period of time. You can gauge the size of your audience by using this metric.
You can also check for views per unique viewer, another metric which tells you the amount of time the average viewer watches your video. This metric is high on music channels because followers are constantly replaying their favourite tunes.
11. Ad Rates
This metric gives you data on YouTube’s Ad revenue, playbacks, CPMs, and impressions that have come from a YouTube Ad.
You can use this information to understand and compare how different ads have worked over a period of time and which has given the best return on investment.
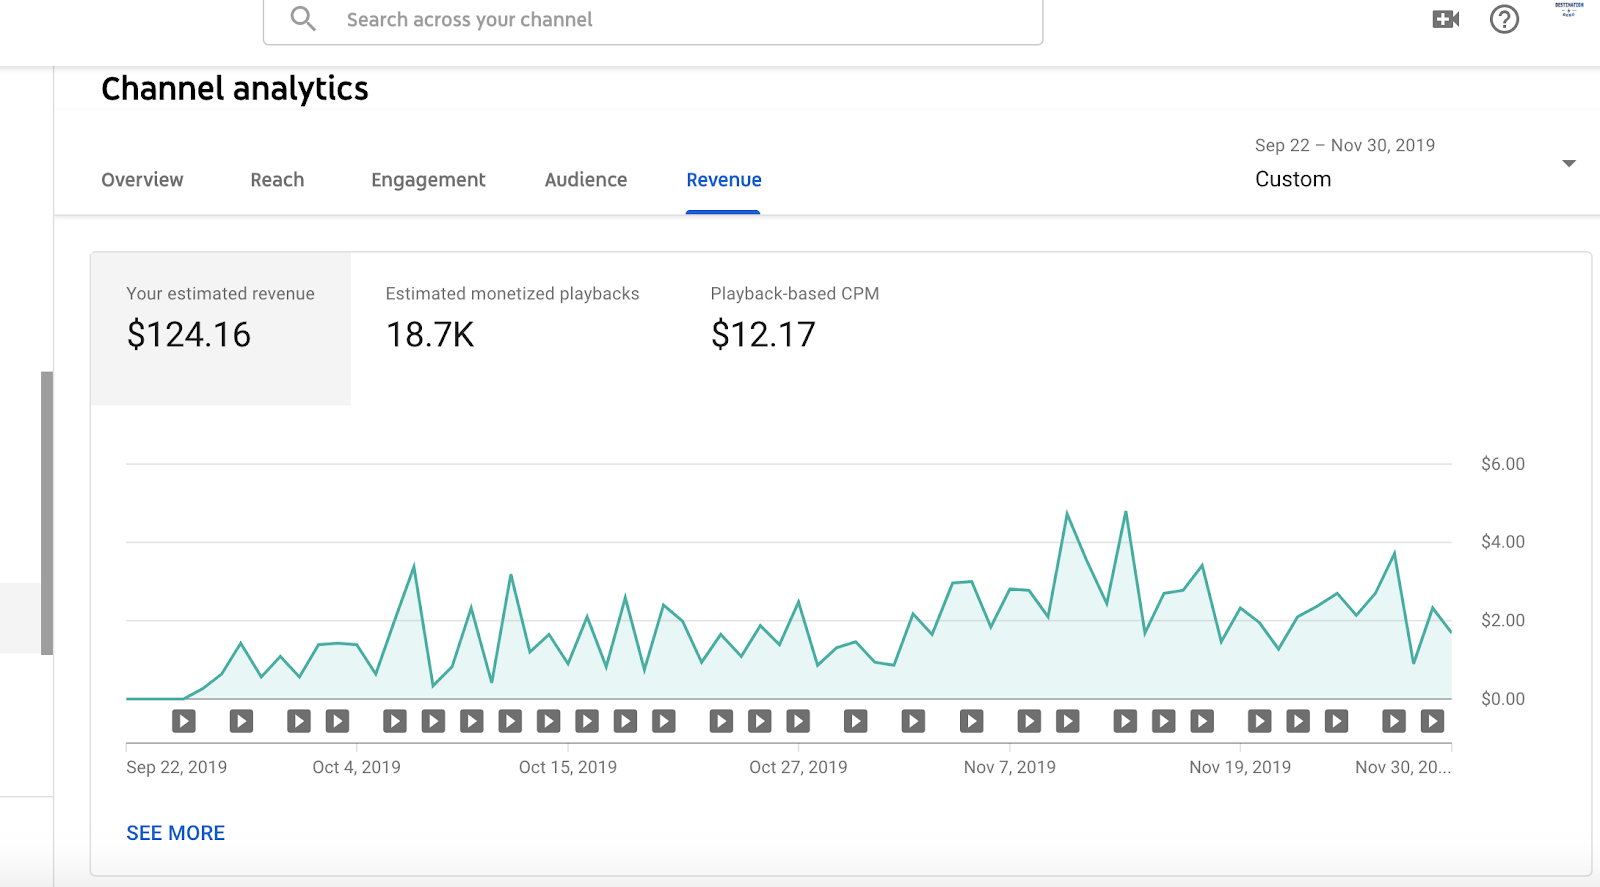
12. Revenue
Your YouTube earnings can be kept track of by checking this metric. However, you can only see your estimated earnings on YouTube analytics and your final earnings can be found in your AdSense report.
You can filter the data on the revenue graph based on region, time, and on a per video basis to get specific details. This can help you plan your strategy better.
To have a deeper understanding of your YouTube channel’s analytics, you can take a quick 6-chapter course on YouTube’s Creator Academy.
Every YouTuber needs tools that will make it easier to slay at the YouTube game. Check out the essential toolkit for every YouTuber.