


One out of two users now uses Instagram to discover new brands and over 91% of them engage with videos from brands on a weekly basis. This shows the huge shift in Instagram’s user behavior, its algorithm, and its business features over the last decade – making it one of the most important platforms to leverage for brand and business growth. In fact, InVideo also relies heavily on its Instagram channel to reach out to newer audience sets and strengthen connect with existing ones.
So, to help you out, we’ve put together a list of the latest Instagram statistics that you should be aware of as you plan your Instagram marketing strategy for 2026. And if you are already leveraging the platform but would like to double down on your video content to scale your growth, you should definitely sign up for a free account on InVideo to get access to thousands of Instagram video templates, over 8M+ stock assets and a robust online editor to aid your goals. And while you are it, do check out the InVideo Instagram channel for useful tips & tricks that will further simplify the process of creating videos for your business.

Here’s what we will cover:
1. Top Instagram statistics
2. Instagram user statistics
3. Usage & engagement statistics
4. Instagram post statistics
5. Instagram story statistics
6. Instagram Reels statistics
7. IG live statistics
8. Instagram video statistics
9. Instagram business statistics
10. Instagram ad statistics
11. Instagram influencer statistics
Let’s dive right in.
1. Top Instagram Statistics

- Over 1 billion people use Instagram every month—that’s more than any other social media platform besides Facebook (Hootsuite).
- More than 500 million Instagram accounts use Instagram Stories every day (Hootsuite).
- 200 million Instagram users visit a business profile at least once per day. (Hootsuite).
- More than 130 million users tap an Instagram Shopping post every month (Hootsuite).
- Over half of Instagram accounts use the Explore page to discover new content (Hootsuite).
- 81% of people surveyed say they turn to Instagram to discover new products and purchases (Hootsuite).
- 47% of Millennials in a recent survey say they use Instagram as a messaging app (Neal Schaffer).
- 33% of B2B companies are now using Instagram (Foundation).
- Brands posting stores on Instagram have an 85% completion rate, meaning the majority of viewers watch their stores until the end (SM Perth).
- 60% of brands use an interactive element on Instagram every week. Interactive elements include stickers, mentions, and music (SM Perth).
- The top 50 Instagram influencers have over 3.1 billion combined followers (Social Blade).
2. Instagram User Statistics

- There are over 2 billion monthly Instagram users in the world (CNBC).
- Instagram is the 4th-most-used social media platform in the world (DataReportal).
- Instagram’s global monthly users has increased by over 2,200% since 2013 (CNBC).
- 87% of all Instagram users live outside of the United States (Omnicore).
- India has the most Instagram users with 201.1 million (Statista).
- The U.S. has the 2nd-highest number of Instagram users with 157.1 million (Statista).
- 57.9% of Instagram users in the United States in 2021 were female (Statista).
- 71% of global Instagram users are under the age of 35 (Statista).

- 31.9% of U.S. Instagram users (52.92 million) are 25-34 years old, 22.8% (37.82 million) are 18-24, and 19% (31.52 million) are 35-44 (NapoleonCat).
- Nearly 6 million Instagram users in the U.S. are over the age of 65 (NapoleonCat).
- 45% of Instagram users live in an urban area (Pew Research).
- 31% of U.S. adults aged 18-34 have a “highly favorable” opinion of Instagram according to the 2021 Morning Consult poll of 2,200 adults. Adults aged 35-44 polled at 23%, 45-64 at 15%, and 65+ at 4% (Morning Consult).
3. Instagram Usage & Engagement Statistics

- 24% of all mobile internet users access Instagram at least once per month (Backlinko).
- The average American Instagram user spends 29 minutes per day on the platform (Backlinko).
- Americans aged 18-25 spend an average of 5.5 hours per week on Instagram (Measure Protocol).
- Children aged 4-15 in the U.K. spend an average of 40 minutes per day on Instagram (Qustodio).
- The average engagement rate (likes and comments divided by the number of account followers) for an Instagram post is 5.86%. The average number of engagements for an Instagram post is 460.6 (HubSpot).
- Instagram posts that are location tagged get 79% more engagement than posts that don’t (HubSpot).
- The posting time with the highest global engagement is between 11:00am and 2:00pm CDT (HubSpot).
- The average business Instagram post engagement rate across all industries is 0.67% (RivalIQ).
- Higher Ed brands have the highest average engagement—3.19%—rate among all brand categories (RivalIQ).
- Instagram video posts are more than 2 times more likely to generate engagement than image posts (Mention). This means that if you haven’t yet, you need to hop on the video bandwagon for your brand’s Instagram presence. Thankfully this is very easy to do with an intuitive video editor like InVideo.
4. Instagram Post Statistics

- Over 50 billion photos have been uploaded to Instagram (Spokesman).
- 1,074 photos are uploaded to Instagram every second (Omnicore).
- Images account for 68% of all Instagram feed posts (Quintly).
- 39% of U.S. Instagram users browse their feed at least once per month (eMarketer).
- 29% of U.S. Instagram users post to their feed at least once per month (eMarketer).
- Central Park is the most Instagrammed tourist attraction in the world with over 6 million posts (Winfields).
- Carousel posts see the highest average global engagement with 1.08%. Photo posts have an 0.81% average engagement, and video posts have an 0.61% average engagement (Statista).
- Photos with faces get 38% more likes than photos without faces (Omnicore).
- The most-liked Instagram post was by @world_record_egg, which received over 56 million likes (WordStream).
- The median number of comments on image posts is 5.76 (Social Insider).
- Clarendon is the most popular Instagram filter (Backlight).
- 48% of Instagram posts use emojis in the caption (Statista).
- 36% of Instagram posts use over 300 characters in the caption (Quintly).
- #Love is the most popular hashtag on Instagram, being used over 1.7 billions times (SM Perth).
- The average Instagram post contains 10.7 hashtags (HubSpot).
- Brands, however, use less than that, averaging between 3 and 9 hashtags per post (SM Perth).
- 7 out of 10 hashtags are branded (Omnicore).
- Posts with 1, 2 or zero hashtags actually perform the best on average (Mention).
- Over one-third of Instagram posts use 1-3 hashtags (Quintly).
- Instagram now has more formats for video posts than static posts – namely feed videos, Reels, Stories, Lives, and IGTVs.
- 70% of marketers are looking to increase ad spend in video (Growthoid)
Pro Tip: With Instagram focusing more and more on video, it goes without saying that using video posts will help you increase reach and engagement. Check out this section for more Instagram video statistics. And if you want to bring your video ideas to life, consider signing up for a free account on InVideo, which offers over 5,000 templates, easy-to-use features, and a comprehensive stock assets library to help you create compelling videos in minutes.
5. Instagram Stories Statistics
- Watching other people’s stories is the most popular Instagram activity in the U.S. (eMarketer).
- Users tapped forward on Instagram Stories 68% of the time in 2020 (99 Firms).
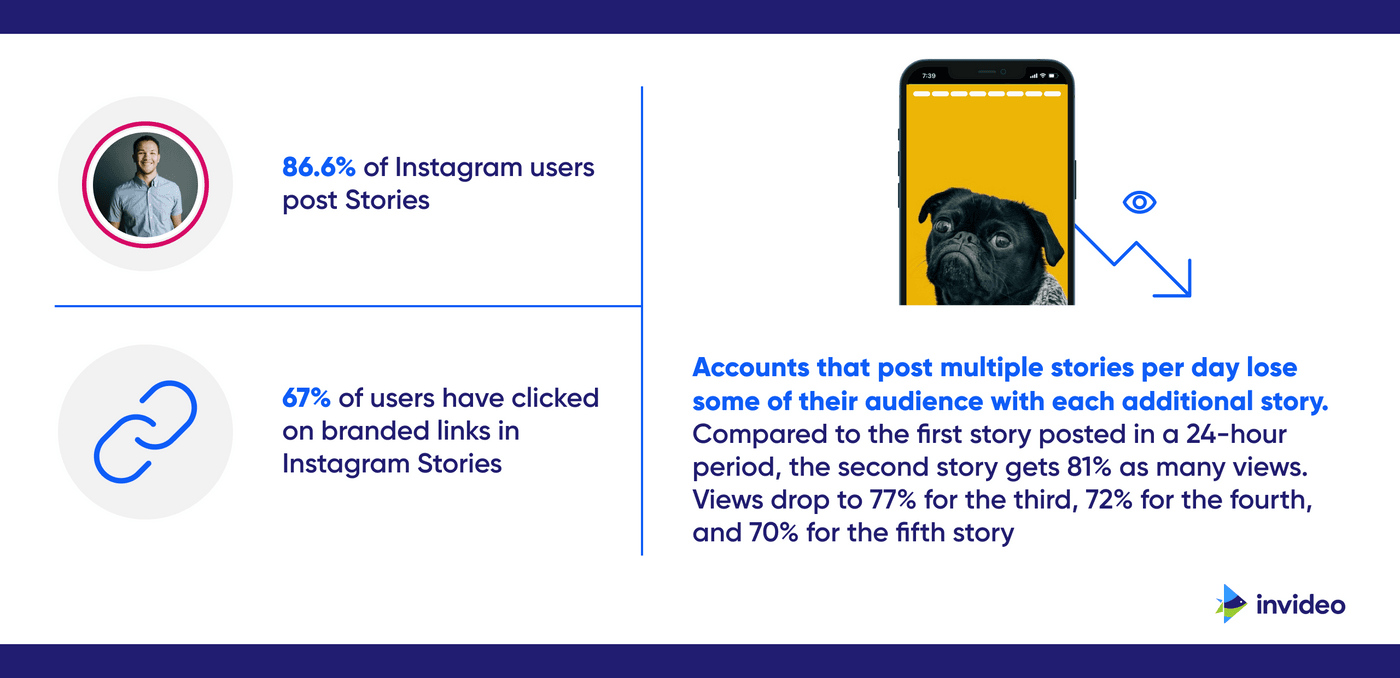
- 86.6% of Instagram users post Stories (99 Firms).
- 67% of users have clicked on branded links in Instagram Stories (HubSpot).
- Instagram Stories is almost twice as popular as Snapchat (Growthoid).
- The heart love sticker is the most popular sticker in Instagram Stories (Instagram).
- Instagram accounts with over 100K followers are more likely to post video stories than photo stories (SocialInsider).
- Instagram accounts with over 100K followers average over 49 Instagram Story posts per month—more than double the amount from 2020 (SocialInsider).
- Accounts that post multiple stories per day lose some of their audience with each additional story. Compared to the first story posted in a 24-hour period, the second story gets 81% as many views. Views drop to 77% for the third, 72% for the fourth, and 70% for the fifth story (SocialInsider).
Pro Tip: Instagram stories can help you sell your products and services better than any other content type on the platform, provided you use them right. If you struggle to come up with engaging stories for your brand, you can try our Instagram story templates that will help you create high quality video stories in minutes.
6. Instagram Reels Statistics
- Instagram Reels offer 8% more screen real estate than TikTok videos (Conviva).
- 87% of Gen Z agrees that Instagram Reels and TikTok are “basically the same thing” (SM Perth).
- Instagram Reels debuted in Brazil and is now available in over 50 counties, including the United States (Later).
- Instagram Reels videos can be up to 60 seconds in length (Instagram).
- Instagram Reels leads all other short-form video apps in average engagement, with global users spending an average of 53 minutes per session (MediaKix).
Pro Tip: If you’re looking to improve your reach on Instagram with the use of video, you definitely need to create and post Reels consistently. If you struggle with finding ideas for Reels, you can check out this blog and if you already have ideas that you would like bring to life, consider using our Instagram video editor to create engaging reels within a matter of minutes.

7. Instagram Live Statistics

- Instagram Live is the 3rd-most used platform for livestream e-commerce, after YouTube and Facebook (RetailTouchPoints).
- 45% of Indian internet users report frequently watching influencer livestreams. This compares to 29% of Chinese, 23% of Brazilian, and 17% of American internet users (LabsNews).
- 43% of Americans aged 18-34 use Instagram Live (Statista).
- 80% of users say they’d rather see a live video from a brand than read a brand’s blog . 82% of users say they prefer seeing live video from a brand than other social posts (AdSpresso).
8. Instagram Video Statistics

- Video posts make up 14.9% of all content on Instagram (Social Pilot).
- Users spend 80% more time watching Instagram videos today than they did in 2017 (Growthoid).
- Instagram video posts are more than 2x more likely to generate engagement than image posts (Mention).
- Overall, video posts get 38% more engagement than image posts (Kicksta).
- The median number of comments on Instagram video posts is 11.1 (SocialInsider).
- 58% of marketers use Instagram videos, according to a 2020 survey of worldwide marketing professionals (Wyzowl).
- Sponsored video posts get 3 times as many comments as sponsored image posts (Impact).
Pro Tip: Want to start leveraging videos for your Instagram but don’t know what to create? Use our Instagram video editor to access 5000+ ready-to-use templates and create thumb-stopping videos in minutes even if you’ve never edited a video before
9. Instagram Business Statistics

- There are 200 million business accounts on Instagram (Omnicore).
- Only 71% of businesses are currently using Instagram (Omnicore).
- 86% of U.S.-based online stores have an Instagram account, the highest percentage of any country in the world. This compares to 81% for U.K.-based and 75% for German online stores (Statista).
- Business Instagram accounts grow their followers by 1.46% every month (Hootsuite).
- Instagram is the #1 platform for following brands (Marketing Charts).
- LikeToKnowIt was the most mentioned brand on Instagram in 2020, with 609.9 million mentions (Statista)

- 90% of Instagram users follow at least one business on the platform (Instagram).
- 80% of users have turned to Instagram to help them make a purchase decision (Facebook).
- Business accounts across all industries average post an average of 4 times per week (RivalIQ).
- Beauty, fashion, health, and media brands all average over 6 posts per week (RivalIQ).
- 37% of American men and women report using Instagram to make holiday purchase decisions (Tinulti)
- 23% of global shoppers say they most likely to make purchases through Instagram over other social networks (Wunderman Thompson).
- 47% of American shoppers make purchases via Instagram (Statista).
10. Instagram Ad Statistics

- Instagram made $17.4 billion in ad revenue in the United States alone in 2020. (eMarketer).
- By 2026, Instagram could generate up to $39.7 billion in ad revenue in the United States (eMarketer).
- 29% of marketers say they spend most of their social media ad budget on Instagram ads (Smartly)
- 50% of users say they’re more interested in brands and products after they see them featured in Instagram ads.
- Users prefer ad content shot on mobile devices over ads produced in a studio 63% of the time (Instagram).
- 29% of marketing professionals report that photo is the most effective ad format on Instagram (Hanapin Marketing).
- 97% of marketers spend money on social media advertising (Hanapin Marketing).
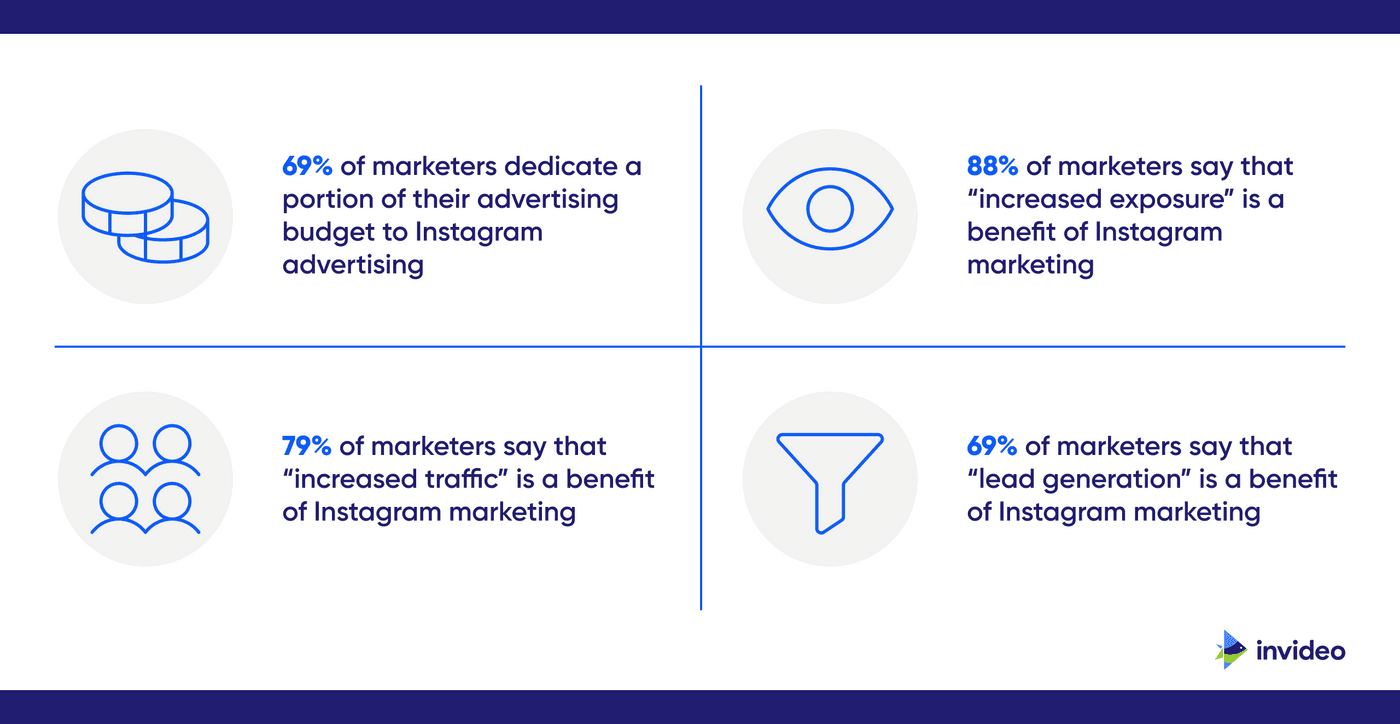
- 69% of marketers dedicate a portion of their advertising budget to Instagram advertising (Hanapin Marketing).
- What are the top benefits of Instagram marketing according to marketers? Increased exposure (88%), increased traffic (79%), and lead generation (69%)g (Social Media Examiner).
- According to Meta, Instagram Reels ads have the potential to reach 675.3 million users (DataReportal).
- Instagram Reels’ ad reach makes up 45.7% of Instagram’s total ad reach (DataReportal).
- 53.9% of Instagram Reels’ ad audience is male (DataReportal).
- 46.1% of Instagram Reels’ ad audience is female (DataReportal).
Pro Tip: With 71% of advertisers intending to spend more on social video ads, and 27% of them specifically targeting Instagram, it’s time to make video ads a part of your Instagram marketing arsenal. You can do this easily by creating ads within minutes using the Instagram video ad maker from InVideo.

11. Instagram Influencer Statistics

- The Instagram influencer marketing industry is worth $1.7 billion (MediaKix).
- 43% of the world’s consumers follows at least one social media influencer (YouGov).
- With 401.2 million global followers, Cristiano Rinaldo is the top influencer in the world (Statista).
- With 136.2 million Indian followers, Virat Kohli is the top influencer in India (HypeAuditor).
- Lifestyle influencers make up 11.59% of all global Instagram influencers (Statista).
- There were 6.12 million brand-sponsored Instagram posts in 2020 (MediaKix).
- 55.39% of Instagram influencers worldwide fraudulently inflate either their follower or engagement numbers (Statista).
- Mega-influencers (over 1 million followers) charge an average minimum of $1,118 per post (Statista).
Macro-influencers (between 100K and 1 million followers) charge on average between $165-$1,804 per post (Statista).
- Influencers with less than 100K followers charge anywhere between $10 and $296 per post (Statista).
- Influencers with less than 15K followers have the best average engagement rates—3.86% (InfluencerMarketingHub).
What’s holding back businesses from marketing on Instagram?
Instagram is one of the most effective social media platforms for brand marketing, yet only 71% of brands are using it. For smaller businesses, creating content and maintaining a presence on the platform can turn out to be too much work, especially with video taking precedence and making the barrier to entry much higher.
But marketing on Instagram and creating videos to grow your brand doesn’t have to be a daunting task. To begin with, you need a solid strategy in place that helps you generate leads and grow your business. The second thing you need is the right set of tools, starting with a video editing platform that allows you to create content without spending hours on it – which is where our Instagram Video editor comes in.
With a robust cloud-based editor, a library of over 5,000 templates and 8M+ stock media and streamlined video editing process, you can begin creating videos even if you’ve never edited a video before. Want to see how it works? You can get started for free today.
This post was written by Adete and edited by Abhilash from Team InVideo